
Network Monitoring · Zabbix 7.0 LTS
Zabbix Enterprise Observability
Open-source infrastructure, network and service monitoring with dashboards, alerting and distributed proxies.
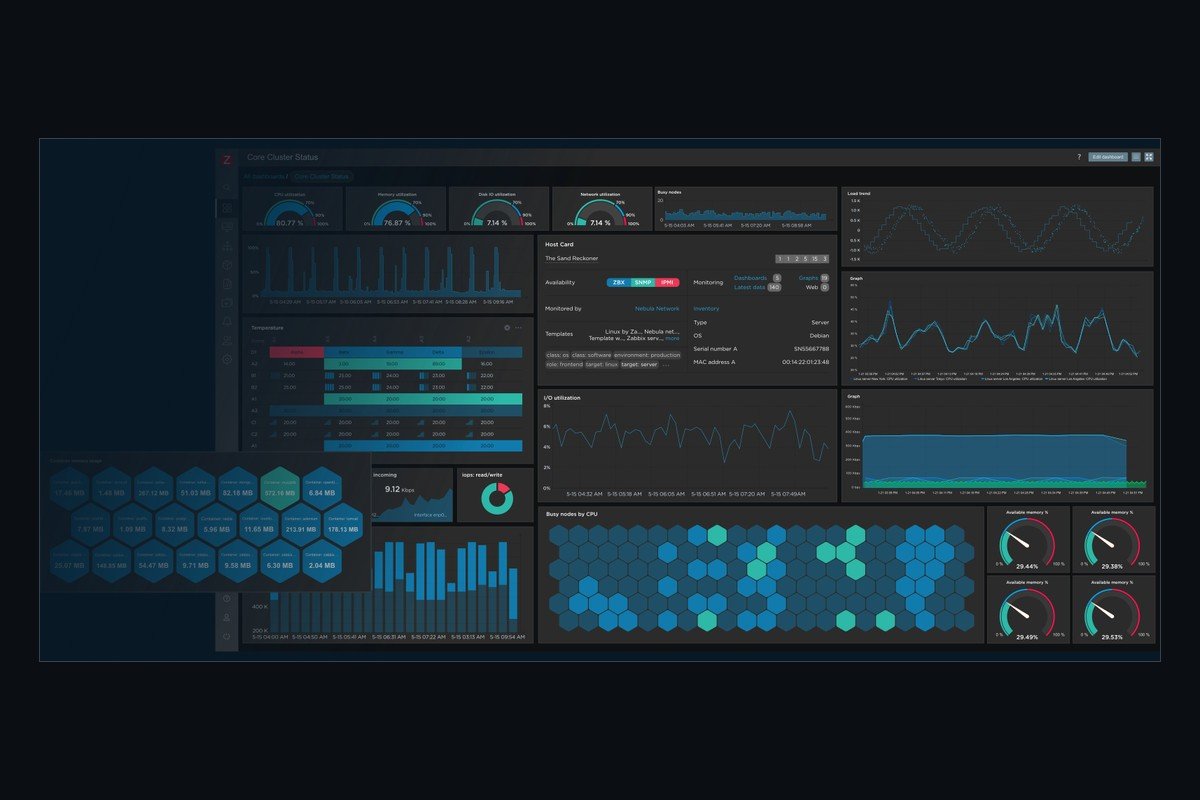
Zabbix monitors servers, network devices, broadcast appliances and services using agent, agentless, SNMP, IPMI, JMX and WMI checks. We deploy it with templates for encoders, multiplexers, switches and UPSs, plus dashboards and escalation paths for headend operations. Distributed proxies extend coverage to remote sites and return-feed paths, while the API and webhooks connect monitoring to ticketing and operations tooling.
Technical specifications
- Product type
- Open-source enterprise observability platform
- Data collection
- Zabbix agent/agent2, SNMP v1/v2c/v3, IPMI, JMX, WMI, HTTP checks and traps
- Telemetry
- Metrics, logs and traces
- Discovery
- Network and host auto-discovery with low-level discovery
- Alerting
- Triggers, escalations, media channels, maintenance windows and SLA reporting
- Visualisation
- Dashboards, graphs, maps and SLA reports
- Scale
- Distributed proxies and high-availability server configurations
- Integrations
- REST API, webhooks, Grafana, email, SMS, Slack, Teams and Telegram
- Templates
- Linux, Windows, SNMP, UPS, switches and custom broadcast equipment
- Deployment
- Linux on-premise or cloud; MySQL or PostgreSQL backend
- Licensing
- Open source; optional commercial support
Specifications are indicative and confirmed in the written quotation. Availability varies by model and region; contact us for current lead times.
Integration
Need this specified into a full headend?
Send us the channel list and service definition. We will return a signal chain design, BOM and installation plan.