
Network Monitoring · Prometheus + Grafana + Loki
Open-Source Observability Stack
Prometheus, Grafana, Loki and Alertmanager integrated for metrics, logs, dashboards and alerting.
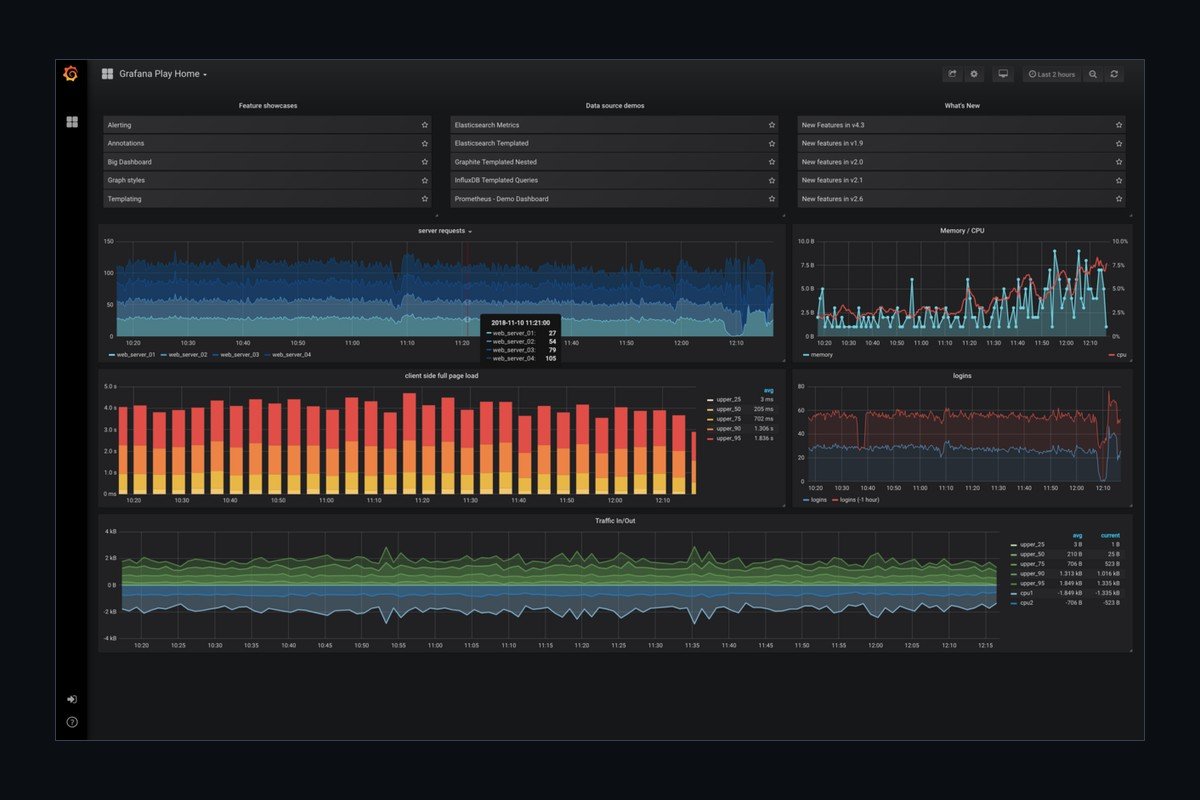
We deploy and integrate an open-source observability stack for broadcast and IT estates: Prometheus for time-series metrics, Grafana for dashboards, Loki for logs, Alertmanager for routing, and exporters for SNMP, blackbox, node and broadcast equipment. It complements Zabbix where long-term metrics, log correlation or custom operational dashboards are required.
Technical specifications
- Components
- Prometheus, Grafana, Loki and Alertmanager
- Metrics
- Prometheus pull model with node, SNMP, blackbox and custom exporters
- Logs
- Loki with Promtail or Grafana Alloy
- Dashboards
- Grafana dashboards, variables, annotations and alert panels
- Alerting
- Alertmanager grouping, inhibition, silences and routing
- Storage
- Local TSDB and object storage for logs; configurable retention
- Deployment
- Docker, Kubernetes or Linux; high-availability options
- Integrations
- Zabbix, ticketing, chat, email and SMS
- Use cases
- Capacity, SLA, QoE and return-feed telemetry with log correlation
Specifications are indicative and confirmed in the written quotation. Availability varies by model and region; contact us for current lead times.
Integration
Need this specified into a full headend?
Send us the channel list and service definition. We will return a signal chain design, BOM and installation plan.